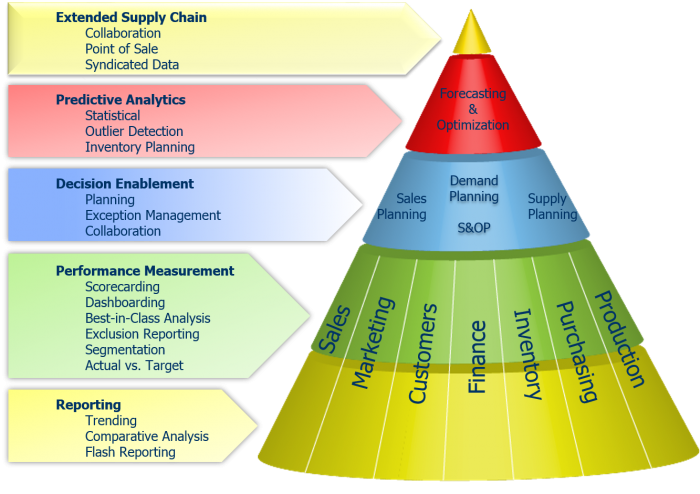
An Evolutionary Approach to BI
 Phased deployment is a strategy that favors an incremental approach to rolling out Business Intelligence (BI) solutions, typically starting with a single department or application within a company. In contrast to enterprise-wide deployment, phased deployment allows early lessons learned to shape future roll-outs and ultimately bring greater visibility and performance management to business users on an enterprise level.
Here’s a proven 5-step strategy to follow when deploying and evolving with BI.
Basic Reporting
Start with a relatively small department or business unit, possibly one with a never ending backlog of report requests. For most of our own customers, that’s the Sales area, which generally has numerous requirements for flash reporting, comparative analysis and sales trending information.
After achieving success there, methodically expand your roll-outs to include more business units and integration with more information systems. Also keep in mind that performance variables and factors related to a department’s objectives seldom reside entirely within that department alone. Instead, processes flow across line-of-business areas and data often resides in redundant operational silos. As a result, a corporate data warehouse should be considered as part of the BI deployment and evolution strategy so that all of your company’s performance reporting can be driven from a single, non-redundant information repository.
With a goal to start small and advance in phases, the reporting project should commence with the end in mind – and decision makers must understand the enterprise-wide impact of their decisions from the start.
Once the reporting structure is in place (even if it’s only for a single department or business unit to begin with), leverage the performance management features of your business intelligence software to take your BI evolution to the next level. This includes the rollout of:
- Scorecards that provide a snapshot to users of how well you’re performing against established targets or goals and what’s driving the score. These active scorecards are good combinations of high-level information with simple access to the detail that was used to derive the information. For most of Silvon’s customers, these types of scorecards present key performance metrics tied to sales, service levels and suppliers.
- Easily accessible, web-based dashboards that provide a highly visual way for users to look at multiple views of information. Dashboards are powerful and graphic. And they’re ideal for presenting business performance data very easily to many users simply by making a web link available to them.
- Exclusion reporting capabilities to help users filter out or segment their business data in order to drive new opportunities and better decisions. For example, giving them the ability to see a list of only those customers who have not submitted orders in 3 or more months.
- Performance reports that highlight actual results to budget, plan or forecast. This is a wonderful way to keep on ongoing pulse on the progress you’re making toward your goals.
Decision Enablement
The next logical step in a phased BI deployment approach is to enable the decision-making process by putting capabilities like these into the hands of business users:
Planning functionality, which is now offered as a component of some business intelligence software systems to help business users model out sales plans, pricing, replenishment and more.
Monitoring and alerting capabilities that can be used to alert end users when performance anomalies require their immediate attention (for example, when inventory is reaching critical levels, sales performance is off X% from forecast, etc.).
Collaboration should also be supported within the BI environment so that users can easily share information views and ideas with others via their PCs and mobile devices.
Predictive Analytics
Next, the valuable insights gleaned from your current and historical data can be used to make predictions about future events. This segment of the BI evolution process is often used by Silvon’s customers to identify and respond to new opportunities more quickly. For example, by looking at a customer’s historical purchase patterns, reasonable predictions can be made about the kinds of promotional offers that will keep that customer buying more — and more often — from you.
Here are some other “predictive analytics” that you can leverage with the visibility provided by your BI solution:
Statistical Forecasts. A forecasting engine can produce an accurate, statistics-based forecast from your enterprise-wide BI repository of current, historical and external data (like point-of-sale).
Outlier Detection. Outlier detection eliminates deviations in your historical data so that “inputs” to the forecasting engine are cleaner and more realistic in nature. For example, past promotional events and their relative impact on sales volume and item performance can be easily erased, ensuring greater accuracy of the new forecast you’re creating.
Inventory Planning. Inventory modeling can be achieved by using a “what-if” tool to calculate safety stock, service level, forecasting and delivery improvements. Our customers often use this capability to model out and optimize lot sizings and economic order quantities, too.
Extended Supply Chain
Ultimately, the collaborative foundation of good BI software will also let you connect beyond the four walls of your business to your extended supply chain. Consider sharing plans and performance information back and forth with suppliers, customers and others. And start using your BI software to analyze external data that can have a direct impact on your business, like point-of-sale, syndicated data, and other third-party information.
This phased approach to business intelligence and performance management is by no means revolutionary; but it’s an evolutionary, lower risk, and very practical way to bring greater business visibility to the people who need it most across the organization.
