Beyond the Dashboard: Data Management Struggles with Visualization Tools
 Power BI and similar visualization tools excel at providing quick access to business data, but they often fall short when it comes to data management and performance optimization. Even those with built-in data management features can be complex and difficult for casual users to navigate.
This article explores the most common data management challenges associated with visualization tools and explains how a modern data hub can effectively and affordably overcome these limitations.
1. Data Compatibility
While information from ERP and other transactional systems can be accessed with visualization and reporting tools, the data structures of these systems are quite complex. As a result, users spend a lot of time wading through an error-prone process to get to the data they need. And once they have it, it’s often difficult to understand what they’re looking at. Plus, not all of the data that analysts need resides solely in transactional applications. This includes plans, budgets, forecasts and other information that employees, suppliers, customers and other third parties may provide. Beyond that, any business logic like taxes based on geographic location or discounts by customer type needs to be manually applied to each report.
What a Modern Data Hub Brings to the Table … A modern data hub supports the integration and management of data derived from many different sources, regardless of whether the sources are internal or external to your business. High volumes of historical and near real-time data can reside in one easily accessible place with a common data model that communicates how all the data is connected to each other, processed and stored. Unlike data visualization tools, users aren’t required to know all this.
A data hub additionally allows users to enhance their data and improve their analytics and reporting by completing, enriching and augmenting their information. As an example, they can supplement customer and product data with additional attributes that are not currently included in ERP systems that source the data. Such capabilities are not supported by standalone versions of Power BI.
And when it comes to business logic, a data hub ensures that all logic related to taxes, discounts, other AR details, and more, is already built in and applied to reports as they are created.
2. Performance Processing
Data visualization platforms also may not be suitable for analyzing large amounts of detailed data; and if you are a person who needs to analyze massive or sophisticated data sets, this can be a major drawback.
In our work with several clients, we’ve found that large datasets and a higher number of concurrent users can slow down a visualization tool’s performance in rendering tables and grids, potentially impacting the efficiency of users. In particular, a dramatic difference in performance and query reports is often noted when loading detailed data. While you can opt out of this issue by creating multiple queries to cover the full range of data and splitting those by date-based categories, it becomes a little time-consuming and complex.
Also, the design of data visualization platforms can complicate the management and refreshing rate of data. This can lead to a lag in report creation and data interaction, which might force decisions to be made based on outdated information in a business setting.
What a Modern Data Hub Brings to the Table … A data hub mitigates performance problems that may arise when reports are run directly against operational systems or when the tools are used to drill down to very low levels of detail within a large data set. Solutions like Silvon’s Stratum data hub not only provide an alternative to accessing granular data directly using visualization tools. A data hub platform enables users of visualization tools to access high-level data and leaves the heavy lifting of granular data access to the data hub itself. This enables users of Power BI dashboards, for example, to drill down to the most granular levels of detail (doing so by drilling through to the detail stored in the data hub without having to load it into Power BI).
In addition, a data hub platform isn’t designed to pull all data into a view at once like a visualization tool’s platform. As a result, performance issues don’t arise, and report designs continue to perform without having to redesign queries.
Data Management Differences (Data Hub vs Visualization Tool Platforms)
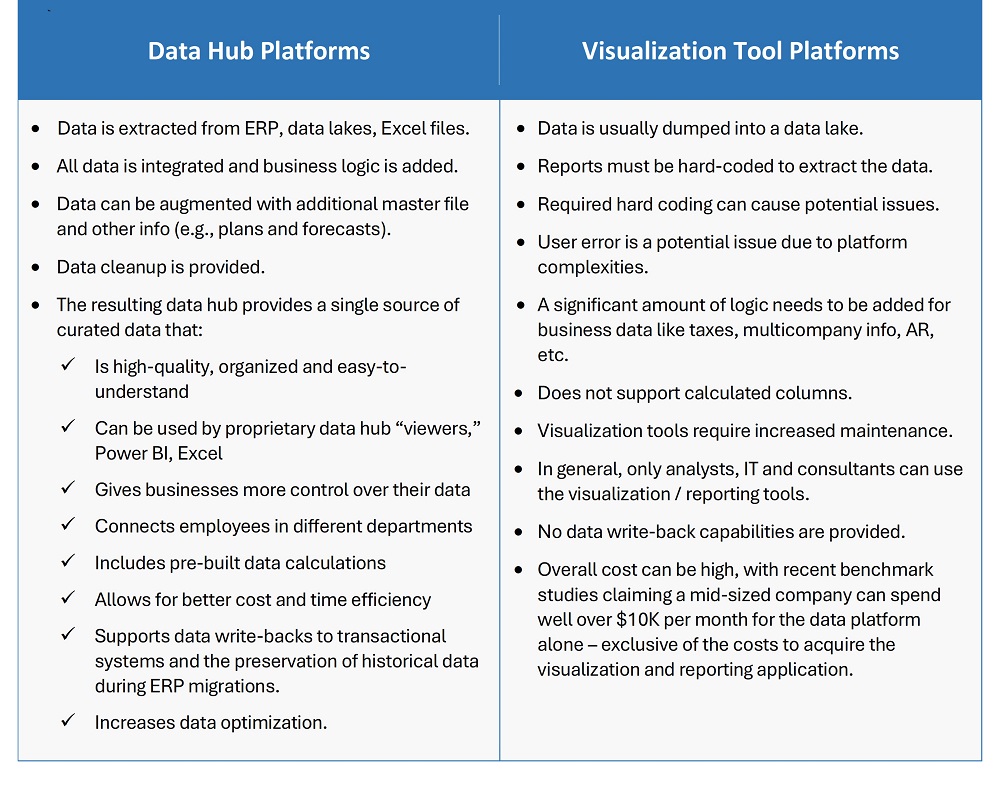 3. Data Quality
Not all visualization platforms offer data-cleaning abilities, including the standalone version of Power BI as of this writing. They assume that the data you pull is cleansed and its quality is high without any further quality checks. And as previously mentioned, business logic needs to be manually added and consistently applied each time a report is created.
What a Modern Data Hub Brings to the Table … A modern data hub collects, organizes and transforms existing data sources into an analytics-ready state. Being analytics ready means the data hub platform can ingest any type of data, no matter where it may reside and include a powerful transformation engine to ensure that every view of information is complete, consistent and trusted.
4. Data Security
Although data visualization tools typically offer a robust security framework, the amount of data that can be secured is limited. As an example, Power BI does not allow row-level security on Excel data sources or any other type of data sources. Such security must be coded into reports. Plus, when editing, users must share reports or files with team members which can hinder report security.
What a Modern Data Hub Brings to the Table … With a data hub-based analytics tool, security is not based on row-level detail of data sources. A data hub’s security is user-based, with access and viewing systematically applied across all reports. Role-based security definitions are used to manage read and write access to data for individual users or groups of users. The end result? Users across the organization have access to the same vetted and secure data with no hardcoding required. And it isn’t necessary to create unique reports for each user either because role-based security allows for a single report to be served up the an entire user community based on what each user (or defined set of users) is allowed to see.
In addition, a data hub can be used to hide certain measures of sensitive data as needed, like costs for a private company
5. Time-Based Data Analysis
When it comes to time-based data analysis, visualization tools offer limited options for calculations based on time, focusing only on displaying data over time. Any time selection and/or comparisons must be coded instead into reports.
What a Modern Data Hub Brings to the Table … The structure of a data hub-driven analytics platform has no restriction in how users view data across time periods, including seasons, promotional periods, etc. A data hub offers an easy way to summarize and select time over ranges without complex calculations (for example, Year to Date, Current Period, Rolling Time Period, Prior ‘n’ Periods, or defined ranges). And in solutions like Silvon’s, pre-built KPI calculations over user-defined time ranges are additionally available. Plus, multiple calendars can be available in a data hub and provide standard, fiscal and custom time periods. This is particularly helpful when reporting directly against ERP tables that present time in Julian formats – a daunting process at best for those analysts who must do.
6. Maintenance & Support
Because of the data management limitations of visualization tools, you can expect to make significant investments in technical support reps or consultants to address data issues and reporting errors.
What a Modern Data Hub Brings to the Table … General maintenance is easily handled by internal solution administrators or the Services team of a data hub vendor; and in most cases, such support is included in the solution’s annual fixed subscription fee.
7. Other Data Considerations
In addition to the points above, a data hub provides a historical repository so that when migrations to different ERPs occur, the history is not lost and trend reporting can continue without interruption. This is a huge benefit that we’ve seen repeatedly in our work with customers and is not typically thought about early enough in the ERP migration planning stage.
Also – data visualization tools typically do not support write-backs natively, requiring costly extensions that are supported by third parties. A data hub overcomes this limitation – enabling sales reps, for example, to provide inputs to a sales plan or forecast and then use the data hub to write back those inputs to the transactional system. Many companies currently rely on Excel to do this, and it can get quite unwieldy very quickly.
A Modern Data Hub: The Perfect Visualization Tool Partner
A trusted data foundation like Silvon Stratum compliments and extends the value of data visualization tools via seamless (vs. hard-coded) integration. It makes self-service BI a reality with built-in data management functionality that lets businesses integrate data from multiple sources into one interface that gives business users the quick insights they need to better run their businesses– either stand-alone or jointly with other visualization and analytic applications.
If interested in learning more, contact us today to speak with a Silvon product specialist.